Instagram —> # Stan Smith —> APIGEE to create a collection of data —> pictures and hashtag —> mapping or story-line
Scarlett and I decided to deepen fashion studies through DH tools that we learned during the semester. Since we are studying fashion, we noticed two different aspects that we would like to develop and that both are necessary in our field. The first one is visualization, while the second one is connectivity. For the first, we decided to start from Instagram. Between all social media we have today, Instagram is based on hashtag and images. Fashion is a visual thing, and the absence of pictures wouldn’t allow its growth. The second aspect would be connectivity: through a specific detail, like Stan Smith shoes, we can trace the visual story of fashion, declined in that specific detail. Marketing strategies, level of interests all over the world, connect people with same passions and interests, etc.… It could not be appealing for someone, but we think fashion owns this power of connection. This is what we consider a tool that has the power of social mobility, etc.…
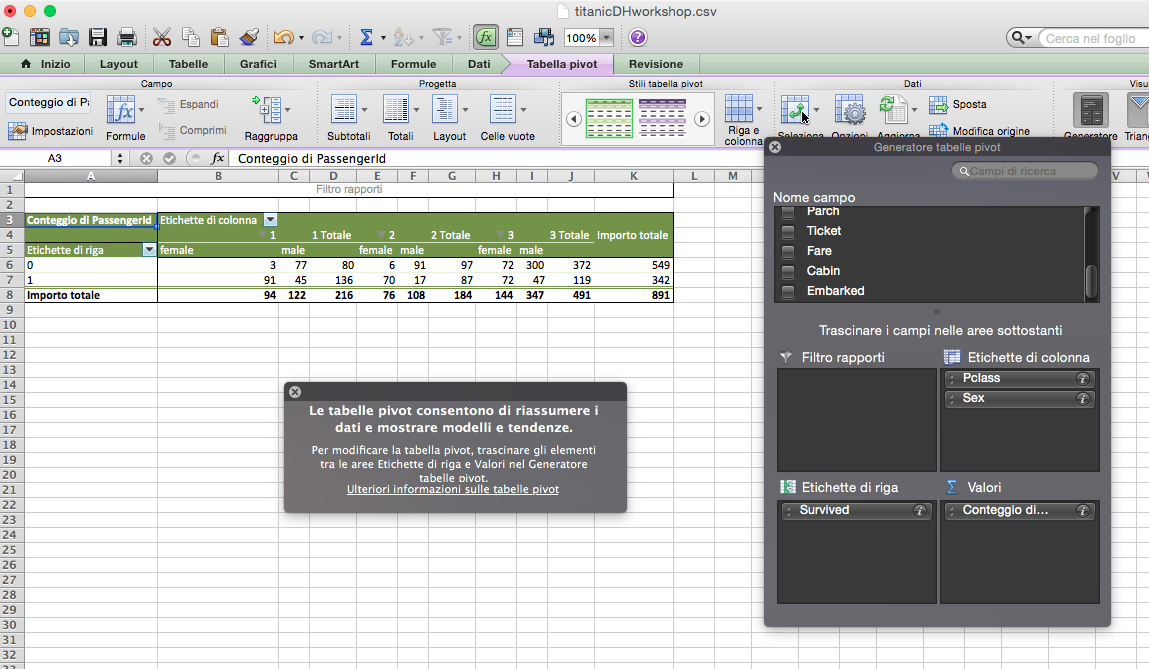
We started with Apigee, the leading provider of API technology and services for enterprises and developers. Hundreds of companies including Walgreens, Bechtel, eBay, Pearson, and Gilt Group as well as tens of thousands of developers use Apigee to simplify the delivery, management and analysis of APIs and apps (http://apigee.com/docs/api-services/content/what-apigee-edge). Our classmates in the Fashion Studies Track have suggested this program to us because it would have helped for a good but simple data project; so let’s see how it works.
Basically we wanted to collect images, find tags with StanSmith, locations all over the world, to see what relationship exists between the world and the shoes. I guess this could also be a good project to keep track of marketing movements in the entire fashion world, and with all the items, not only one specific.
We typed https://apigee.com/console in the search bar and in the page that popped out we chose “Instagram” in the column API. The next step is to select OAuth2 under the column “Authentication” because to interact with data through Apigee is necessary to authorize your Instagram account.
At this point you will have three options (Query, Template and Headers). We chose “Template” (for Instagram) and in the “tag name*” slot we typed our tag “stansmith”. Right after this step the authentication is complete, authorizing Apigee to use your social media account.
It’s necessary to select an API method and it’s important to select the second choice under the “Tags” section of the list.
We only had to click on “send” and the response came: Instagram has pagination, so the data we got were divided in pages. Copying the URL in the picture, and pasting it in a new searching bar we obtained a weird data page in order to see the next page.
Our friend told us that the process was almost complete, but the last step was to download “JSONview” (with Safari it doesn’t work, so we used Chrome), to see the data in an organized form. This step is specifically for an easier visualization of images, profile pictures, username, etc.…and we also found the numbers for “created_time”. This part is very important because converting this numbers from Unix epoch time to GMT is necessary for the visualization of images.
With Epoch Converter we were able to convert everything and the result is a list of data, where every “attribution” is a post. We collapsed the posts, having the chance to look at posted pictures in different resolutions!
For the presentation we’ll provide a Power Point with images step by step of the process to reach this data that we will probably use for a mapping or a timeline of the item.
Thanks for your time,
Nico and Scarlett