The data visualization workshop (10/29) was particularly helpful in understanding how data visualization should be approached. Indeed, the digital fellows stressed to importance to think and visualize with our minds before working with data.
Assuming that we already have a particular set of data, it is essential to understand what and how we would like to visualize. Therefore, it is useless to start right away with excel (and it was indeed, interesting how many of us had this impulse of using right away that software but without really knowing what to do).
We started with a data set sample providing different information about the Titanic’s passengers (gender, survived, age, name, class, etc.). The following step was the decision of which relationships we wanted to visualize. So, (and this is just an example) we picked a few categories such as survival and class, in order to see their relationship. How did class affect the survival rate?
Then, by using some crayons and a white piece of paper, we tried to imagine and reproduce how we wanted to visualize the questions we asked to our data and their relationship.
Pretty soon the how became the big issue. How does a particular visualization convey certain information? How can we avoid confusion and provide a clear understanding of a particular issue?
So, for instance, we moved quite quickly from the pie diagram to different kind of graphs. The pie does its best when we want to show two things: one independent and one independent, in other words, how much is one thing in percentage to the other thing.
In order to provide a clearer representation of more than two categories we looked for a different kind of visualization.
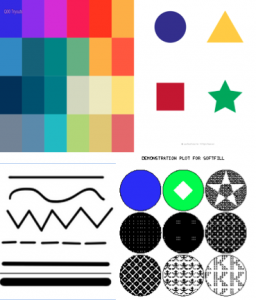
In this process we learned to look carefully at 4 categories that can help us in elaborating different categories and variables in the same visualization:
1) line
2) color
3) shape
4) area/fill
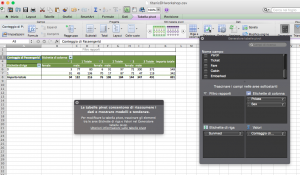
After having chosen the data, and the relationship we wanted to represent, we entered our data in excel. From this point on, we learned to use a powerful excel tool: pivot tables. This function allows users to sort and summarize data according to different criteria. This selection is then represented into a second table. In other words, pivot tables help in understanding particular realtionships and trends in larger data set.
 From this point on, we could use Excel’s previews of different graphs in order to understand which visualization we could use to construct the most effective representation of the relationship we wanted to emphasize.
Finally, the digital fellows suggested us many different softwares paricualry helpful for data visualization:
GUI Based:
– google charts
– tableau
R-ggplot
Python-matplotlib/seaborne/basemap/cartopy
Javascript-D3
Mapping:
GIS-ArcGIS
CartoDB —> change over time
p.s. I’m sorry for the excel picture in Italian 🙂


Thanks for reporting on this workshop! Very helpful! =D