Author Archives: Lisa Hirschfield

Digital Dorothy 2: The Reckoning

I resolved to write a journal of the time, till W. and J. return, and I set about keeping my resolve, because I will not quarrel with myself, and because I shall give William pleasure by it when he comes home again.

And so begins Dorothy Wordsworth’s Grasmere Journals (1800-1803).  At first a strategy to cope with her loneliness while her brothers William and John were away, the journals were soon expanded in purpose to provide a record of what she saw, heard, and experienced around their home for the benefit of her brother’s poetry (apparently, he hated to write). There are numerous instances where her subject matter corresponds with his poems, down to the level of shared language. The most cited of these is an entry she made about seeing a field of daffodils; this was incorporated into the much-anthologized poem “I wandered lonely as a cloud,” which ends with a similar scene.

Dorothy and her brother William had a peculiar and unusually close relationship. She was more or less his constant companion before and after they moved to Grasmere.  She copied down his poems, attended to his needs, and continued to live with him after he married and had a family, She herself never married, and remained with him until his death in 1850. For these reasons she is often portrayed as a woman who lived for him and vicariously through him.

This impression is reinforced by the nature of her writing, which focuses on the minutiae of day-to-day life, and isolated details of the world around her – weather, seasonal change, plants, animals, flowers, etc. – and which she mentions numerous times  will be of use to her brother’s own work. Because her diaries chronicle many long walks in the surrounding countryside, alone or with friends and family, I originally planned to  map her movements around the region and connect this movement to the people she was seeing in the area and corresponding with – to map her world, and see how hermetic and localized it really was.

I created the initial data set by downloading and cleaning a text file of the Journals from Gutenberg.org. There were many ways I could have worked with this data set to make it suitable for mapping. I ended up using several online platforms: the UCREL semantic tagger, Voyant Tools, CartoDB, and a visualization platform called RAW. Working back and forth with some of these programs enabled me to put the data into Excel spreadsheets to filter and sort in numerous ways. 

When I began thinking about mapping strategies and recording the various data I extracted (locations, people, activities), I saw that to ensure accuracy I would have to corroborate much of it by going through the journals entry by entry – essentially, to do a close reading. Because I was hoping to see what could be gleaned from this text by distant reading, I chose to make a simple map of the locations she mentions in her journal entries, in relation to some word usage statistics provided by Voyant Tools. Voyant  has numerous text visualization options, and working with them also encouraged me to think more about the role Dorothy’s writing had in her brother’s creative process; I was curious about how that might be visualized, in order to note patterns or consider the relationship between his defiantly informal poetic diction and her colloquial, quickly jotted prose.

So, I downloaded William Wordsworth’s Poems in Two Volumes, much of which was written during the same period, and processed it in a similar way. Using the RAW tools, I created some comparative visualizations with the total number words common to both texts. I’ve used the images that are easiest to read in my presentation, but there are others equally informative, that track the movement of language from one text to another.

If I were to return to the map and do a close reading, I would include a “density” component to reflect the amount of time Dorothy spent going to other locations, and perhaps add the people associated with those locations (there is a lot of overlap here), and the nature of activity.

I had some trouble winnowing my presentation down to three slides, but the images can be accessed here.

Also, thanks to Patrick Smyth for writing a short Python program for me! I didn’t end up using it but I think it will be very helpful for future data projects.

Hey Girl

For those of you thinking of a public history-oriented final project proposal (like I am), you might appreciate the Public History Ryan Gosling Tumblr.  Although its most recent entry is from 2013 and the meme is old, the ideas are still very relevant. More to the point , this  short post by the authors on the NCPH website explains how they used their Tumblr  to call attention to issues around public engagement, the ethics of historical representation of the “underrepresented”, public communities vs. academic communities, and more. Anyway, it’s a helpful reminder of things to consider while developing a project. Plus Ryan Gosling.

Digital Dorothy

As I described in the last class, I’m going to use a data set that is a text.  At first, I wanted to create a “diachronic” map of a particular place—the English Lake District—which is a popular destination for hikers, walkers, photographers, and Romantic literature enthusiasts. This last category also includes a great many Japanese tourists.

My first plan was to create a corpus of 18th– and 19th-century poetry and prose related to the Lake District (read: dead white males), explore the way landscape was treated, map locations mentioned in these texts or create a timeline, and then add excerpts of text along with the present-day visual data.

For the present-day component, I was thinking about how to scrape and incorporate data and photos from Flickr and Twitter that were tagged with the names of local landmarks and landscape features of the area.

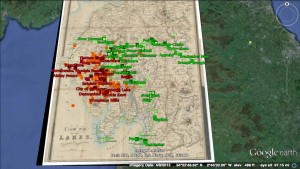
mapping the lakes image in Google Earth

An image from Mapping the Lakes in Google Earth

Early on, I discovered Mapping the Lakes – a 2007-2008 project (apparently still in pilot phase) at the University of Lancaster that uses very similar strategies to explore constellations of spatial imagination, creativity, writing, and movement in the very same landscape. From the pilot project:

The ‘Mapping the Lakes’ project website begins to demonstrate how GIS technology can be used to map out writerly movement through space. The site also highlights the critical potentiality of comparative digital cartographies. There is a need, however, to test the imaginative and conceptual possibilities of a literary GIS: there is a need to explore the usefulness of qualitative mappings of literary texts… digital space allows the literary cartographer to highlight the ways in which different writers have, across time, articulated a range of emotional responses to particular locations … we are seeking to explore the cartographical representation of subjective geographies through the creation of ‘mood maps’.

The interactive maps are built on Google Earth; therefore, don’t try to view this in Chrome. You can also use the desktop version of Google Earth. The project is quite instructive in its aims as well as its faults and failures, and the process and outcomes are described on the website. (Actually, the pilot project might be a very good object lesson on mapping creative expression with GIS.)

However, if you’re interested in this kind of mapping, you should take a look at the Lancaster team’s award-winning research presentation poster on their expanded Lakes project:

I wrote to one of the authors to ask her about it—methodology, data set, etc. She was happy to respond, and was encouraging. Although the methodology is way beyond my technical chops at present, she referred me to a helpful semantic text-tagging resource that they used, and I’m sure will come in handy at some point.

After some floundering around, I defined a data set and project that is challenging but more manageable. It will involve a map and one text: an excerpt of Dorothy Wordsworth’s journals, from 1801-1803— not long after the second edition of Lyrical Ballads was published, and she and her brother moved to the area with their friend Samuel Taylor Coleridge.

The journals are a counterpoint to William Wordsworth’s early poetry, in that she kept them as much for her brother as for herself—recording experiences they had together, and personal observations that she knew would inspire him—to provide the raw material for his poems. There is a not extensive yet established amount of scholarship on the subject. She even describes this collaborative process in her journal—although it’s not called collaboration, and until more recently wasn’t characterized as such by critics.

To prepare the data set, I downloaded the text file of the most complete edition of her journals from Project Gutenberg, took out everything not related to this time period, and did a lot of “find and replace” work to get rid of extra spaces and characters, editorial footnotes, standardize some spellings, and change initials to full names. Following the advisories on the semantic tagging and corpus analysis sites, I also saved the file in both ASCII and UTF-8 text formats, with line breaks. (This may or may not prove necessary, depending on the tools I use later on). I have considered using a concordance tool of some kind (like Antconc) to visualize those connections, since I don’t think that has been done. However, this would entail creating a second data set with the book of poems and it’s a secondary interest.

My primary goals are these:

  • I’m hoping this project will confirm or complicate existing assumptions about Dorothy and her journals, which until now—as far as I know—have only been developed through close reading, not visualization.
  • Using this text, I want to map her life in the Lake District during this period – socially, physically, and emotionally. (In her brother’s case, his poetry does a good job of that, and stacks of books have been written about his relationships to other people, women, landscape, time, etc.)
  • I want the map to be interactive to some degree, so that users can trace these different aspects of her life geographically, by clicking on related keywords. Ideally, I would like to include supplementary images—paintings, engravings, and portraits—that were created in the era, to provide a contemporaneous visual component. Including related excerpts of journal or poetic text would also be helpful: it would be a means of mapping her creativity, in a way. A similar map of  William Wordsworth‘s creativity exists. It is more extensive but not very user-friendly.

On the cartographical front, I have been considering CartoDB and Mapbox. I also looked at the British Ordnance Survey topographical map of the area, which, like all the ordnance maps, is now online. The OS website includes a feature similar to Google maps, whereby you can personalize maps to some degree, and connect text and image data. Of course, Google Earth can be used this way too. Mapbox has nice backgrounds, but less options. CartoDB is visually pleasing,  versatile, and allows for more elegant “pop ups,” which I could use to include bits of text, images from the time, etc. But it can’t be embedded into a webpage. As they come into focus, the project goals will ultimately determine what I use.

In the meantime, I’m using Voyant to explore the text/data set. It is a great resource to help you define the parameters for a more focused project. You can see what I’m working with here. Eventually I will geocode the locations, either by hand or via Google Maps, input location data, temporal data, and data about her social interactions (all in the text) in a CSV file that can be uploaded into a mapping program, and figure out how to connect everything . (Or I will die trying.) I also plan to study the new and improved “Mapping the Lakes” project more carefully, for ideas on how best to present my own, less ambitious project.

Along the way I’ve encountered some other software that may be useful for those of us who like working with olde bookes: VARD is a spelling normalization program for historic corpora (also from Lancaster U. It requires permission to download but that is easy to get).

That is all.

DH Grammar

Last night I attended my first workshop this semester – The Lexicon of DH – and I found it extremely helpful. I was expecting something like a PowerPoint survey of terms, tools, and basic categories, with a bunch of tired people in a classroom. Instead we had an interactive and hands-on workshop in a computer lab, with fellows who have a comprehensive understanding of the material and really know how to teach effectively. That the material could comprise a DH “grammar” was a perspective I hadn’t considered before. I would have called it an “arsenal” – tools. But grammar is especially fitting, because grammar structures meaning at its most basic level, and each tool structures meaning and mediates information – in its own way – at a basic level that should be thoroughly understood before it is used.

Actually, the workshop was a PowerPoint survey of terms, tools, and categories. But having very engaged people coach us through an exploration of this material “in situ” – that is, online, where it lives – made it far more accessible. Too often I find I am still stuck in the “stand-alone” mindset when it comes to digital tools. For instance, although I have used a number of the tools we covered, like Zotero,  I actually haven’t taken advantage of Zotero’s online functionality very much, in terms of capturing bibliographic info. and metadata.  Sometimes you need someone to show you what is right in front of your face. (I do, anyway.)

Being introduced to so many resources for different types of DH tasks and projects in a single two-hour session was a little frustrating.*   And, the plethora of possibilities led me yet again to rethink what my data set should include or explore. That said, I’ve already been exploring a number of different tools on my own – and even have an academic subscription to Tableau, a visualization program – yet have at best a novice’s sense of how best to use any of them. So, I found that even this short summary of certain tools’ capabilities was helpful, in terms of winnowing out what may not be as useful for me right now.  It’s easy for me to get distracted by pretty, shiny websites, and it finally dawned on me that perhaps I should not let the tool I like the most determine my data set – at least when I have minimal or no user experience.

In addition to the material we covered, it was helpful simply to describe my areas of interest in a couple of sentences, look at some examples of projects online, and hear about what other people do or want to do. I was able to step away from the monitor briefly (metaphorically speaking) and affirm that indeed history, texts/material artifacts, and geo-spatial mapping are “my bag,” and that I want to work on something that uses all of these components.+ On the other hand, I still feel the need to connect my rather dusty academic interests (18th C English literature) to contemporary experience and/or socially relevant issues, and this pressure doesn’t help when it comes to figuring out what data sets to find or create and play with.

So, to be continued…

*   I know that workshops for specific tools and programs are held, but they are so limited in terms of space and scheduling that what is an extremely necessary academic resource for most new DH students is not as accessible as it should be.  This is especially true for those of us who work 9-5 and can’t frequent office hours or workshops held earlier in the day. I really hope that this situation will be remedied.  Also, I suggest some in-depth workshops that focus on different types of projects – specifically, which tools and programs can facilitate research, enhance content, and improve functionality for various project types.

+  Last semester, I attempted to do something a little like this in Lev Manovich’s visualization class. For our final project, we each had to create a data visualization reflecting our own experience, so history with a big H was not involved. My project comprised a short, reflective essay with sound files and an interactive map in CartoDB. I had hoped to put everything together on one page, but it is either not easy or else impossible to embed a CartoDB map on a WordPress site.  As a hybrid visualization exercise, it is fine. But my goal for this class is to develop a project that can employ these elements — history, text (which is an elastic term) and mapping in a more comprehensive, meaningful, and engaging way, and that – most important – has both historical and contemporary relevance.  If anyone is curious what that looked like, it’s on my long-neglected blog.

New Cool DH Tool

I subscribe to the American Antiquarian Society blog Past is Present, and I receive all sorts of wonderful things in the emails from them.

After two years of DH development under the guidance of a DH fellow – Molly O’Hagan Hardy – the AAS now has a dedicated DH curator (same person) and an official DH component of their mission, which means (I hope) that even more of their resources will be available to lay-antiquarians like me who cannot slog up to Worcester, MA and noodle around in the archives just for kicks.

Their image archives are especially fun to peruse, and they offer a wealth of resources under the Digital AAS banner.

Anyway, this MARC records conversion tutorial just fell over the transom of my inbox, and I think it could be a very useful tool for one or some of us, if not now, then in the future. Putting your data into a CSV format opens up many possibilities, including data visualizations.

Lisa


Response to Impediments to Digital History (forum post)

See Taylor’s forum post

There are some models for open-access peer-reviewed work (that I mentioned in a forum post last week), which, if they became the “standard practice” for humanities publishing, would address some of the issues you bring up. In the sciences, Plos One seems to have achieved the tricky balance of maintaining open access to intellectual property and its status as a forum for sound, “legitimate,” research.

But, as Taylor points out, it’s not just about access, it’s about money. What are viable funding models for open-access publishing? PubMed is a publicly-funded (NIH) clearing house for research in the health sciences. But it’s highly unlikely that public funding would sustain open-access publication in the humanities. 1) public money is scarce (even for the sciences these days; 2) public money isn’t necessarily managed or spent well, and spending decisions are often highly idiosyncratic, depending on who’s making them (exemplified by the Library of Congress controversy); 3) unlike scientific research, the humanities doesn’t have the promise (at least in theory) of a “final product” that can be marketed for profit. Its only product, other than scholarship and scholarly engagement, is experiential: this requires interactive public engagement, which requires that the public is interested, which requires that public is aware of its existence. Which is the only outcome that is justifying public (or much of private) funding in the humanities these days. Put another way, how does a Kickstarter campaign to digitize an archive of crumbling, century-old Haitian newspapers with immense value to Francophone historians compete with a campaign to support an independent documentary feature film?

Possibly the LoC could connect with, or help to establish partnerships, with organizations similar to PLOS One. There are existing open-access humanities and multidisciplinary networks that were established in Europe, like the Directory of Open Access Journals, which is a non-profit that survives through corporate sponsorship and membership fees. Matt mentioned the UK’s Open Library of Humanities . It is also an independent non-profit, and presumably has both government and private sponsors.

It’s not really a “crowdsourced” publication model like those I mentioned above, but the Smithsonian/Folkways project is an interesting example. (The Smithsonian acquired Folkways Records after Moses Asch died so that this material would be preserved.) It operates as commercial-private venture, and receives no public funding. It’s not really a forum for hard-core academic scholarship, but it has a wealth of artifacts and information on ethnomusicology and music history. A good deal of its offerings are fee-based, but it also offers free access to playlists, podcasts, and teaching tools, some free downloads, and lots of information on American and world folk music. Its collection and archive are open to researchers; if these alone were made freely accessible off-site, they would be an invaluable public resource. In certain ways, it looks like a large-scale model of that used by the American Social History Project at the GC.


Disciplinarity debates – suggested readings

The media analysis project David proposed seems extremely timely. The top hits in a Google search on science and humanities brought up article after article about the crisis in the humanities, the perceived or false threat to the humanities by scientific and quantitative approaches, the scientism and the humanities (cf the very public 2013 argument between Leon Wieseltier and Steven Pinker in The New Republic – http://www.newrepublic.com/article/114127/science-not-enemy-humanities and http://www.newrepublic.com/article/114172/leon-wieseltier-scientism-and-humanities ), etc. It all gets so old after while! And it’s not a new set of concerns.

But I came across a NEH grant proposal narrative / position paper prepared by SUNY Binghamton in 2008 for a project that sought to address the Science v. Humanities smackdown before it ever reached its current frenzy. They begin with “C.P. Snow’s (1959) description of the humanities and sciences as ‘The Two Cultures.’” And the project was aimed at breaking down this dichotomy where it matters most, at the level of the classroom (rather than continue the argument at the disciplinary level, which doesn’t actually do anything but feed the fire). Some of the project description is understandably very specific in terms of activities, but it also addresses larger theoretical questions, such as how humanities research and scientific research can complement or enhance each other in a given subject, and how a holistic investigation and interpretation of evolution, for example, could encompass different approaches to the material that are both equally valid and equally necessary: “Through evolutionary theory and its study of both ultimate explanations (such as biological fitness) and proximate explanations (such as the function and importance of the arts to human survival and development), we think that the 21st century will witness an integration of human-related subjects. Moreover, because of its emphasis on the crucial developmental functions of art, this integration can help restore the centrality of the perspectives and subjects currently associated with the humanities. ”

The project description also surveys the modern history of this disciplinary antipathy, which I think is very useful for background. Although it is not specifically a DH project, it addresses some fundamental assumptions and anxieties that contribute to current divisions and drive the debate in academia. And, as these ideas “trickle down” into the popular press, they generate both the less partisan articles like those David suggested, as well as those that politicize and perpetuate these divisions in (I think) unnecessary ways. The proposal is here: http://evolution.binghamton.edu/evos/wp-content/uploads/2009/08/Wilson-02.pdf

What isn’t code?

I’ve been thinking more about “What is Code?” by Paul Ford, and the relationship of code (whether a given iteration or the Platonic ideal) to human discourse and language (whether spoken, signed, written, grunted, pictured).

Last semester I had my first experience writing actual code, learning to use the language R for a course in data visualization.* It was incredibly difficult, not least because, as I insisted, “my brain just doesn’t work that way.”

But it’s language, right? Like human language, code has grammar, syntax, and vocabulary. Like human language, there are often many ways to say the same thing, but only some of them will be intelligible, clear, and get the result you want. (Human language, however, is much more forgiving when it comes to sentence structure.) Just as learning human language (sometimes) requires a lot of exposure and/or memorization, so (usually) does learning code.

Ford says “C gave you an abstraction over the entire computer, helping you manage memory and processes inside the machine. Smalltalk gave you an abstraction over all of reality, so you could start dividing the world into classes and methods and the like” (43).

Doesn’t symbolic representation and language do the same for us? I’m sure it’s hardly an original analogy. But language is the medium through which we encounter and understand the world. It’s an abstraction “over all of reality” that allows us to encounter reality. It categorizes experience and structures thought.So, I’m wondering how far the comparison stretches.

Human language is not unidirectional – a set of utterances aimed at achieving a result in the external world – it also impacts our thinking and comprehension and emotional states. Does code operate both ways as well?

Well, as Ford suggests, quoting from Structure and Interpretation of Computer Programs, “A computer language is not just a way of getting a computer to perform operations … it is a novel formal medium for expressing ideas about methodology. Thus, programs must be written for people to read, and only incidentally for machines to execute” (104).

Unlike most human languages, which slowly evolve over millennia, new types of code are constantly in R&D. (At least, it’s probable that more people know R or C++ these days than Esperanto or Volapuk.) Watching computer languages develop, with their specialized vocabulary, grammar, syntax, and logic –which we can use to create, interpret, and “express ideas about methodology” — are we actually witnessing new ways of describing the world take shape in real time?

You know how frustrating it is when no word exists in [your native] language for an idea or feeling, or a word for something can’t be translated? Ford describes something similar: “But my first thought when I have to accomplish some personal or professional task is, What code can I use? What software will teach me what I need to know? When I want to learn something and no software exists, the vacuum bugs me …”(112).

Lastly, if language is the foundation of a culture, what about code? As Ford says of the various camps coders fall into, “These languages contain entire civilizations.” But it’s more than personality types and whom he entrusts with what tasks. The way he describes frameworks, for example, code has the potential to manifest types of cultural or institutional discourse:

“There are hundreds of frameworks out there; just about every language has one”. (84)

You have entered into a pool with many thousands of other programmers who share the framework, use it, and suggest improvements; who write tutorials; who write plug-ins that can be used to accomplish tasks related to passwords, blogging, managing spam, providing calendars, accelerating the site, creating discussion forums, and integrating with other services. You can think in terms of architecture. Magnificent! Wonderful! So what’s the downside? Well, frameworks lock you into a way of thinking. (86)

Isn’t most [all] of the critical theory of the past 50 years aimed at the unlocking discursive frameworks that have shaped human relations and the way we think about the world?

This is a very broad analogy, I realize. But that’s the way my brain works.

*Technically, this is not true. In the early 1980s my stepbrother (now a lifer at IBM) had a Commodore Vic-20 and taught me to write simple programs in BASIC that would do 
things like tell my stepsister she was stupid, or print my name across the screen in 
alternating white and black columns. When I expressed interest in learning more, he 
held up the thick BASIC manual and I ran off screaming into the land of literary 
language and The Phantom Tollbooth. What a mistake!