The Lexicon of DH

The Lexicon of DH Slides

I spoke to Mary Catherine Kinniburgh who gave the Lexicon of DH workshop with Patrick Sweeney and asked her if I could post it on our page, and she said it was okay to do so.

As I mentioned in class yesterday, I am a visual person.  I need to see the light at the end of the tunnel to know the where, the what, and mostly the how.  Going to this workshop and the way that Mark Catherine and Patrick gave the workshop, helped myself and other classmates see that light as to how we will be able to prepare our data sets and prepare for our final projects.

On a personal note, it helped me understand the past readings better and also as I was preparing for yesterday’s class, I could understand the readings on mapping with a new visual perspective.  As I read, I thought of what digital tools would I use to do that.  For me, this is progress.

Good luck with your data sets and projects.


GC Digital Fellows workshop on Data Visualization

Tonight’s GC Digital Fellows workshop on data visualization was a great overview of the tools available for making visualizations and the considerations that anyone must take into account when trying to do so. Michael Mandiberg started by walking us through the difference between infographics (made by people) and data visualizations (made by machines). He discussed the importance of balancing content and form, and the different roles that data visualizations can play — be they for rhetoric, education, persuasion, art, or a combination thereof. He reminded us that anytime you are operating in a visual field, you are navigating design problems. He shared readings and videos — Hans Rosling on Google’s Public Data Explorer, Noah Ilinsky’s Designing Data Visualization, David McCandless’s Information is Beautiful, and the “I Like Pretty Graphs” video on Youtube. He also shared data visualization tools — wordle.net and tagxedo.com to make tag clouds; Google Ngrams to track the frequency of keywords in texts through time; Google Public Data Explorer for easy visualizations of publicly available data sets; Gephi for visualizing networks; and D3, an open-source JavaScript library for all kinds of beautiful interactives. (Here’s a list of the best d3.js examples, which he pointed us to.)

His final takeaways for visualizing data: The most important thing is to start by knowing what question you want to ask. Then find the appropriate form to represent and/or answer your question. Keep in mind that the entire enterprise of your data and software is rooted in a context, form, and ideology. But that said, with data visualization you can learn some really cool stuff.

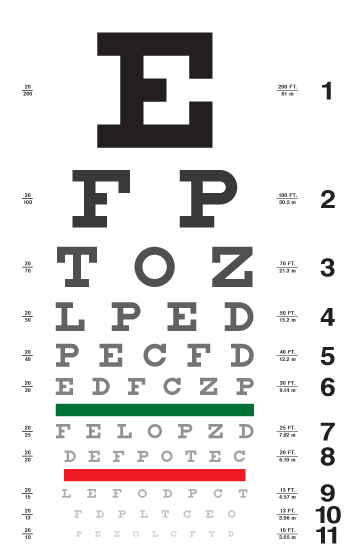
With all of these tools, resources, and examples, the workshop repeatedly returned to pedagogical applications. For example, we explored representations of keywords in presidents’ State of the Union Addresses from various points through US History. These keywords were visualized in an optometrist’s list, with the most frequently appearing words located in the “E” spot. We agreed that these posters would be useful tools to generate discussion about changing trends through American history — for example, what does it tell us that Lincoln’s most prominent word was “Emancipation” and George W. Bush’s was “Terror”?

It’s just one example, but really there are countless applications of data visualization for the classroom.


Plot Mapping abstract literature

I’ve been thinking all week about our discussion in class last Monday, regarding the usefulness of topic modeling software, and how the results can be pretty misleading depending on what your aiming is in using it. I’ve been thinking about turning this plot mapping software on essentially chaotic or even “plotless” novels (specifically the works of Thomas Pynchon)—what would that look like? Would it actually illuminate anything? What would turning any of these mapping or modeling tools on Pynchon, a writer who doesn’t esteem plot as an important element of his writing, do for our understanding of his work? Would topic modeling help make his abstract work more accessible? Would “word bag” approach help us understand more abstract literature that doesn’t rely on standard elements we’ve come to expect (such as a linear plot)?

Highly Recommend

On Wednesday, October 27th, I attended The Lexicon of Digital Humanities workshop. It was great. The fellows, Mary-Catherine and Patrick, were professional, helpful, and, obviously, very knowledgeable in the subject area. What I liked most and did not expect was the interactive atmosphere during the workshop. It is easier to focus in the classroom after a long workday if you are an active participant rather than a passive recipient. During The Lexicon of Digital Humanities we were introduced to a number of tools. Unfortunately, there was not enough time to explore them. Nevertheless, I found it helpful. At the DH seminars we are asked to search for tools and describe them, but it is rather hard to decide what exactly you want to work on having opened DIRT. At the workshop, the fellows showed us what was available and gave us time look into what seemed interesting. That way, I discovered Neatline, a few days before opening the homework page:). Now I am considering it as the essential part of my data project.

The Lexicon of Digital Humanities workshop delivered a huge amount of information in a very short time span to a full classroom of participants. I cannot speak for everybody, but it is unlikely someone felt left out. The digital fellows get A+.

Data Set Project – Titanic Survivors

I’ve thought of and discarded a number of ideas about what to work on for my data set project. I started looking through lists of publicly available data sets hoping something would catch my interest or inspiration would strike.

At https://github.com/caesar0301/awesome-public-datasets I came across a csv file with Titanic passenger survival data. The file listed passenger names, sex, cabin class, and ticket price as well as other information. I thought it could be an interesting set to work on.

The problem with finding information from a collection called “Awesome Public Datasets” is that there was absolutely no information about who created this file or where it came from. After some more digging I found a similar data set posted by the Department of Biostatistics at Vanderbilt University, complete with information about who created and where they found their information.

http://biostat.mc.vanderbilt.edu/wiki/pub/Main/DataSets/titanic3info.txt

While the history of the Titanic and it’s passengers is well covered, but I like the idea of testing some of my assumptions about this data, and considering interesting or unexpected questions to explore.

For example I assume there will be a direct correlation between how much a passenger paid for their ticket, and whether or not they survived. I also expect to see a similar relationship with gender, with the assumption that women were more likely to survive than men. If both of those assumptions appear to be true after examining the data, then I’m curious whether wealth or gender will appear to be a more substantial factor.


Data Stories podcast on Text Visualization

Distant reading meets data visualization:  The most recent episode of the Data Stories podcast interviews Chris Collins of the University of Ontario Institute of Technology about his work on text visualization. The conversation was helpful for me to understand further applications of this kind of text analysis — e.g. to recognize patterns in login passwords, or to explore how false information spreads on Twitter. Plus Franco Moretti gets a shout-out halfway through.

I might be biased, since I’ve recently started helping to produce this podcast (though not this particular episode), but I think the show is worth checking out in general. Many episodes are relevant to the concerns of our course.

DH Grammar

Last night I attended my first workshop this semester – The Lexicon of DH – and I found it extremely helpful. I was expecting something like a PowerPoint survey of terms, tools, and basic categories, with a bunch of tired people in a classroom. Instead we had an interactive and hands-on workshop in a computer lab, with fellows who have a comprehensive understanding of the material and really know how to teach effectively. That the material could comprise a DH “grammar” was a perspective I hadn’t considered before. I would have called it an “arsenal” – tools. But grammar is especially fitting, because grammar structures meaning at its most basic level, and each tool structures meaning and mediates information – in its own way – at a basic level that should be thoroughly understood before it is used.

Actually, the workshop was a PowerPoint survey of terms, tools, and categories. But having very engaged people coach us through an exploration of this material “in situ” – that is, online, where it lives – made it far more accessible. Too often I find I am still stuck in the “stand-alone” mindset when it comes to digital tools. For instance, although I have used a number of the tools we covered, like Zotero,  I actually haven’t taken advantage of Zotero’s online functionality very much, in terms of capturing bibliographic info. and metadata.  Sometimes you need someone to show you what is right in front of your face. (I do, anyway.)

Being introduced to so many resources for different types of DH tasks and projects in a single two-hour session was a little frustrating.*   And, the plethora of possibilities led me yet again to rethink what my data set should include or explore. That said, I’ve already been exploring a number of different tools on my own – and even have an academic subscription to Tableau, a visualization program – yet have at best a novice’s sense of how best to use any of them. So, I found that even this short summary of certain tools’ capabilities was helpful, in terms of winnowing out what may not be as useful for me right now.  It’s easy for me to get distracted by pretty, shiny websites, and it finally dawned on me that perhaps I should not let the tool I like the most determine my data set – at least when I have minimal or no user experience.

In addition to the material we covered, it was helpful simply to describe my areas of interest in a couple of sentences, look at some examples of projects online, and hear about what other people do or want to do. I was able to step away from the monitor briefly (metaphorically speaking) and affirm that indeed history, texts/material artifacts, and geo-spatial mapping are “my bag,” and that I want to work on something that uses all of these components.+ On the other hand, I still feel the need to connect my rather dusty academic interests (18th C English literature) to contemporary experience and/or socially relevant issues, and this pressure doesn’t help when it comes to figuring out what data sets to find or create and play with.

So, to be continued…

*   I know that workshops for specific tools and programs are held, but they are so limited in terms of space and scheduling that what is an extremely necessary academic resource for most new DH students is not as accessible as it should be.  This is especially true for those of us who work 9-5 and can’t frequent office hours or workshops held earlier in the day. I really hope that this situation will be remedied.  Also, I suggest some in-depth workshops that focus on different types of projects – specifically, which tools and programs can facilitate research, enhance content, and improve functionality for various project types.

+  Last semester, I attempted to do something a little like this in Lev Manovich’s visualization class. For our final project, we each had to create a data visualization reflecting our own experience, so history with a big H was not involved. My project comprised a short, reflective essay with sound files and an interactive map in CartoDB. I had hoped to put everything together on one page, but it is either not easy or else impossible to embed a CartoDB map on a WordPress site.  As a hybrid visualization exercise, it is fine. But my goal for this class is to develop a project that can employ these elements — history, text (which is an elastic term) and mapping in a more comprehensive, meaningful, and engaging way, and that – most important – has both historical and contemporary relevance.  If anyone is curious what that looked like, it’s on my long-neglected blog.
You Are Listening To New York: Reflections on Open APIs

The Digital Fellows workshops here at the GC have far exceeded my expectations of what a 2-hour seminar tends to be. There’s just only so much technical material that can be absorbed in such a small window of time. That being said, the real strength of these workshops comes from the capable Digital Fellows leading the discussions, and the superb, thorough documentation they provide.

Out of the workshops I’ve thus far attended (Server Architecture, Introduction to Webscraping, etc), I’ve found the Lexicon to be the most useful, as it touched, very briefly, on a range of DH tools and approaches. In fact, it was so successful in communicating an overview of the emerging field, that it has thrown my dataset/final project planning for a loop (for another blog post).

One fairly important aspect of DH project development glossed over during the Lexicon was the importance of open APIs. I wanted to share a project that uses open APIs to wonderful effect. The “You Are Listening To” project utilizes open APIs to curate an immersive user experience centered around a mashup of ambient music and real time transmissions of police radars and airwave communications from cities around the world. Check out this link for You Are Listening to New York.

What I like so much about this site is it’s simplicity. It’s an elegant digital curation of various streaming media. When you load the page there’s a javascript file that pulls in an audio stream from radioreference.com, which provides the police radio audio feed. It also pulls up a soundcloud list that has been screened by the site’s creator Eric Eberhardt to ensure that it only incorporates, ambient, dreamy soundscapes that contrast with and compliment the police scanner audio. It also loads the page’s background image (of the user’s chosen city), which is pulling from Flickr’s API. This is all legal, free, and only possible because each of the companies made an effort to provide access to their site through simple web APIs.

There’s also a ton of additional metrics in the “i” info dropdown to the website. It looks like it’s accessing  twitter and reddit feeds, a geotracking tool to provide metrics about and for listeners, some google reference info, and various news trackers.

Have a look!


The Problem of Libraries

We didn’t get to talk much about Ramsay last night, but this review of John Palfrey’s BiblioTech covers some of the same intellectual ground

http://www.nybooks.com/blogs/nyrblog/2015/oct/26/what-libraries-can-still-do-bibliotech/

So is the library, storehouse and lender of books, as anachronistic as the record store, the telephone booth, and the Playboy centerfold? Perversely, the most popular service at some libraries has become free Internet access. People wait in line for terminals that will let them play solitaire and Minecraft, and librarians provide coffee. Other patrons stay in their cars outside just to use the Wi-Fi. No one can be happy with a situation that reduces the library to a Starbucks wannabe.

Perhaps worst of all: the “bookless library” is now a thing. You can look it up in Wikipedia.

Topic Modeling (Goldstone and Underwood readings)

In reference to the reading on Topic Modeling, I’m interested in how this method might be useful in regards to pulling data from fashion publications (Vogue, Harper’s Bazaar, W etc.) Topic Modeling is defined as a form of text mining, a way of identifying patterns in a corpus. You take your corpus which groups words across the corpus into “topics.” We’ll say that the reoccurring words or “topics” are trends. If I’m applying this to my fashion research, then trends could be searched literally across 5 years worth of words collected in a magazine. What are the “trends” (words and actual style trends) that occur the most frequently from 1960 to 1965? 1975 to 1980? Were there specific topics being talked about in these chunks of time that happened to reoccur? In these chunks of time did the topics vary by publication? Did the language stay the same? I am interested in pulling data from publications, but I’m not sure if I want to pull text data or photo data (as in, maybe, how many times in a decades worth of issues from Vogue were black models featured in editorials).

We’ll see.

Scarlett