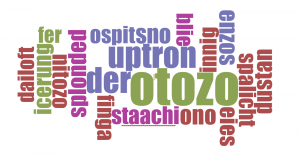
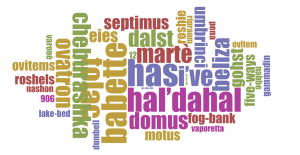
For my dataset project, I eventually used a combination of – – – Voyant Tools, Sublime Text, and Excel – – – to generate / visualize the words that DO NOT appear in the dictionary (based on a list of words from the MacAir file) – that is, “neologisms” in two manuscripts of my own poetry: PARADES (a 48 pg chapbook, about 4000 words total, fall 2014), & BABETTE (a 100 pg book, about 5500 words total, fall 2015).
The process looked like this :
- Voyant Tools (to generate word frequencies in manuscripts)
- Sublime Text (to generate plain text and CSV files)
- Excel (to compare words in manuscript to words in dictionary)
- (& back to) Voyant Tools (to generate word clouds with new data set)
- (& back to) Excel (to generate column graphs with new data set)
*****
Here are the results for neologisms that occur more than once in each manuscript, in 4 images :
vs.
*****
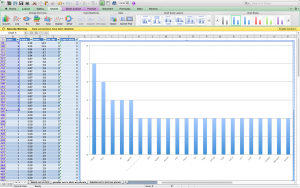 PARADES column graph (screen shot)
vs.
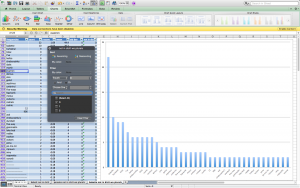 BABETTE column graph (screen shot)
*****
What did I learn about the manuscripts from comparing their use of neologisms this way?
- Contrary to what I thought, I actually used MORE neologisms in Babette than I did in Parades
- The nature of the neologisms I used in each manuscript (do they sound like Latin, like a “real” word in English, like a “part of a word” in English, or like an entirely different thing altogether?)
- … SINCE I actually only finished creating these visualizations today (!) this kind of “interpretation” is much to be continued!
*****
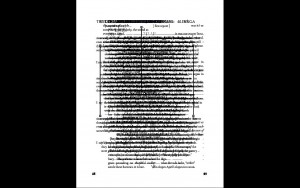
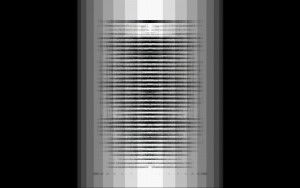
I ALSO tried to visualize the “form” (shape on the page) of the poems in each manuscript using IMAGE J – here are a few images and animations from my experiments with PARADES (you have to click on the links to get the animations… not sure they will work if IMAGE J isn’t downloaded) :
parades image J sequence parades images projection image j 2
Projection of Projection parades min z Projection of SUM_Projection
